


16 Jul Reorder point planning and Forecasting models
Reading time: 4 min
Keywords: SAP, MRP, reorder point planning, forecasting, Akaike information criterion
Reorder point planning in SAP constitutes a part of the so-called Consumption-Based Planning, which is itself a part of the MRP procedures. It is one of the main tools that help planners determine the expected demand and schedule stock replenishment accordingly.
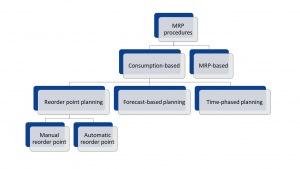 Image 1: Overview of MRP procedures
Planners need to manage the types and quantities of materials they purchase strategically; plan which products to manufacture and in what quantities; and ensure that they are able to meet current and future customer demand—all at the lowest possible cost. MRP helps companies maintain low inventory levels. Making a bad decision in any area of the production cycle will cause the company to lose money. By maintaining appropriate levels of inventory, manufacturers can better align their production with rising and falling demand.
The basic principle of Reorder Point Planning is to execute respective checks, in order to determine whether the sum of plant stock and firmed receipts falls below the reorder point (If the available stock falls below the reorder level, an order proposal is generated. The reorder point is made up of the sum of the safety stock plus the expected average material consumption within the replenishment lead time).
The reorder point should cover the average material requirements expected during the replenishment lead time-RLT. The safety stock exists to cover both excess material consumption within the replenishment lead time and any additional requirements that may occur due to delivery delays. Therefore, the safety stock is included in the reorder level.
The following values are important for defining the safety stock:
• Past consumption values (historical data) or future requirements
• Vendor/production delivery timelines
• Service level to be achieved
• Forecast error, that is, the deviation from the expected requirements
Manual Reorder Point Planning
In manual reorder point planning, you define both the reorder level and the safety stock level manually in the master data record of the respective material.
Automatic Reorder Point Planning
In automatic reorder point planning, both the reorder level and the safety stock level are determined by the integrated forecasting program.
The system uses past consumption data (historical data) to forecast future requirements. The system then uses these forecast values to calculate the reorder level and the safety stock level, taking the service level, which is specified by the MRP controller, and the material’s replenishment lead time into account and transfers them to the material master.
Since the forecast is carried out at regular intervals, the reorder level and the safety stock level are continually adapted to the current consumption and delivery situation. This means that a contribution is made towards keeping stock levels low.
Forecast-Based Planning
Like reorder point planning, forecast-based planning operates using historical values and forecast values as future requirements are determined via the integrated forecasting program. However, in contrast, to reorder point planning, these values then form the basis of the planning run in forecast-based planning. The forecast, which calculates future requirements using historical data, is carried out at regular intervals.
This offers the advantage that requirements, which are automatically determined, are continually adapted to suit current consumption needs. If, during the current period, the material has already been withdrawn from stock, then the forecast requirement is reduced by the quantity of material that was withdrawn. This means that the quantity of the forecast requirement that has already been used is not included in the planning run again. You can specify the period split for the forecast (daily, weekly, monthly, or per accounting period) and the number of periods to be included in the forecast individually for each material.
The following forecast strategies are available in SAP for performing calculations:
• Automatic model selection
• Average
• Moving average
• Weighted moving average
• Simple exponential smoothing (constant model)
• Linear exponential smoothing (trend model)
• Seasonal exponential smoothing (seasonal model)
• Trend-seasonal exponential smoothing (multiplicative seasonal component)
• Trend-seasonal exponential smoothing (additive seasonal component)
• Linear regression
The automatic model selection forecast strategy allows you to let the system select the forecast model that best fits the trend of the historic data, but if you already know that a particular forecast model is well matched to the time series trend, or if you explicitly want to use a forecast model for other reasons, you can select a particular forecast model.
In the automatic model selection, the suitability of a model is measured by Akaike’s Information Criterion (AIC).
The Akaike information criterion (AIC) is a mathematical method for evaluating how well a model fits the data it was generated from. In statistics, AIC is used to compare different possible models and determine which one is the best fit for the data. AIC is calculated from:
• the number of independent variables used to build the model.
• the maximum likelihood estimate of the model (how well the model reproduces the data).
The best-fit model according to AIC is the one that explains the greatest amount of variation using the fewest possible independent variables.
How to compare models using AIC
AIC determines the relative information value of the model using the maximum likelihood estimate and the number of parameters (independent variables) in the model. The formula for AIC is:
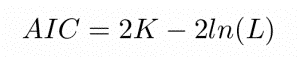
K is the number of independent variables used and L is the log-likelihood estimate (a.k.a. the likelihood that the model could have produced your observed y-values). The default K is always 2, so if your model uses one independent variable your K will be 3, if it uses two independent variables your K will be 4, and so on.
To compare models using AIC, you need to calculate the AIC of each model. If a model is more than 2 AIC units lower than another, then it is considered significantly better than that model.
SUMMARY
Reorder point planning and Forecasting models are some of the main tools that help planners manage the types and quantities of materials they purchase strategically. SAP provides multiple options and models, either automatic or manual, that help in Material Requirements Planning.
References:
- https://help.sap.com/viewer/ec6cdb924d4549bebf1adc4b5cf87b19/6.00.30/en-US/5697b6535fe6b74ce10000000a174cb4.html
- https://help.sap.com/viewer/9245d6c05bd24d0ba7f18bd06e29c70c/6.05.16/en-US/7964df3f3e054e1de10000000a155106.html
- https://help.sap.com/viewer/9245d6c05bd24d0ba7f18bd06e29c70c/6.05.16/en-US/6f90163f6b5baa09e10000000a114084.html
- https://www.technosap.com/sap-overview/reorder-point-planning-sap-mm/
- https://www.scribbr.com/statistics/akaike-information-criterion/
- https://stanfordphd.com/AIC.html