


06 Jul Monitor, control and improve your processes with Statistical Process Control
Reading time: 5 min
Keywords: SPC, Statistical Process Control, Control chart, Acceptance chart, Shewart chart, Cp, Cpk, deviation notifications, SPC in SAP, trend analysis, vendor analysis
Author: Elpida Mezili
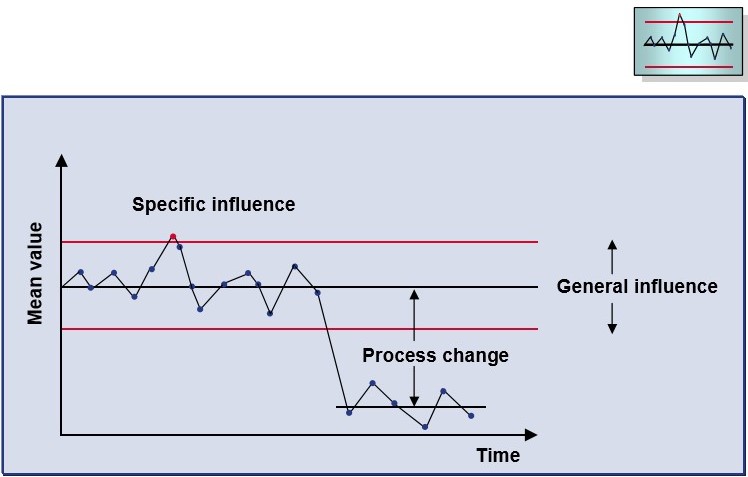
Statistical Process Control is the process of detecting systematic deviations from the targets maintained for a particular quality characteristic. The central tool to carry out this analysis is the Control Chart.
The Control Chart is a graphical tool that tracks one or more control variables of the characteristic. The most important variables are:
- Mean value
- Standard deviation
- Median value
- Range
- Original value of a sample
- Number of nonconforming units
- Number of defects
The chart also contains action limits and/or warning limits. These action limits can be used to trigger the valuation of the inspection characteristic result as also for triggering workflow if defect recording for characteristic is set up.
The control chart is different from the run chart. Whereas the run chart also plots the individual measured values or mean values, it does not contain action limits. Instead, it contains the tolerance range limits.
SPC is generally used to monitor the production process and correct necessary processes if consistent deviations are observed. However, it can also be used in monitoring the quality of materials received from a vendor, or the quality of materials shipped to/returned from customers.
The most commonly used control charts are Acceptance charts and Shewart charts. Others include:
- Moving mean-value chart
- EWMA chart
- Original value and moving range chart for sample size n=1
- NP-chart for the number of nonconforming units
- P-chart for the fraction of nonconforming units
- C-chart for the number of defects
- U-chart for the number of defects for each sample unit
The appropriate chart is maintained in the sampling procedure.
Displaying/Changing Control Charts
Control charts can be called either from the “Results Recording” screen or from the transactions QGC1 (Control charts for inspection lots), QGC2 (Control charts for task list characteristics), and QGC3 (Control charts for master inspection characteristics). Each control chart is given a chart number by the system. This number is generated the very first time results are recorded against an inspection lot (provided SPC settings have been maintained). The status of these control charts is “New.” Activating the chart changes the status to “Active.” When not needed anymore, the chart can be closed, and the status changes to “closed.” If the SPC criterion is maintained for a given material/characteristic across several lots, then a new number is not given unless the old chart is closed.
Calculation of Capability Indexes
The calculation of capacity indexes is based on the assumption, that the measurements follow a standard normal distribution.
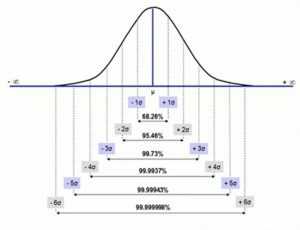
There are two important measures that are used for measuring the process capability: Cp and Cpk values.
For a quantitative characteristic, the values are calculated as follows.
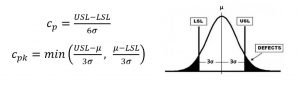
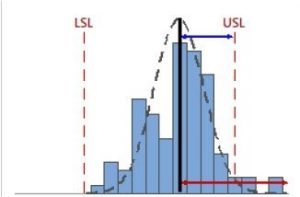
Where USL and LSL are the tolerance range limits, μ is the mean value and σ are the estimated values of the mean and the standard deviation of the distribution.
Cp: Emphasis on the process spread
The process spread is often defined as the 6-sigma spread of the process (that is, 6 times the within-subgroup standard deviation). Higher Cp values indicate a more capable process.
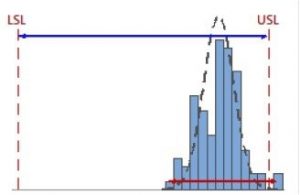
When the specification spread is considerably greater than the process spread, Cp is high.
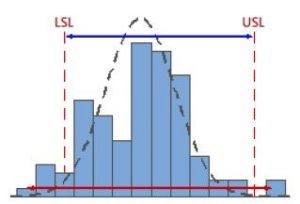
When the specification spread is less than the process spread, Cp is low.
By using the 6-sigma process spread, Cp incorporates information about both tails of the process data. But there’s something Cp doesn’t do—it doesn’t tell you anything about the location of the process data.
For example, the following two processes have about the same Cp value (≈ 3):
Obviously, Process B has a serious issue with its location in relation to the spec limits that Cp just can’t “see”.
Cpk: Emphasis on the nearest specification limit
Like Cp, Cpk is also a ratio of the specification spread to the process spread. But unlike Cp, Cpk compares the distance from the process mean to the closest specification limit, to about half the spread of the process (often, the 3-sigma spread).
When the distance from the mean to the nearest specification limit is considerably greater than the one-sided process spread, Cpk is high.
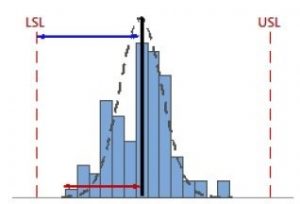
When the distance from the mean to the nearest specification limit is less than the one-sided process spread, Cpk is low.
Notice how the location of the process does affect the Cpk value—by virtue of its being calculated using the process mean.
Yet there is something important that Cpk doesn’t do. Because it’s a “worst-case” estimate that uses only the nearest specification limit, Cpk can’t “see” how the process is performing on the other side.
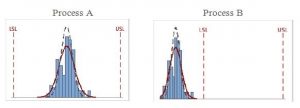
For example, the following two processes have about the same Cpk value (≈ 0.9):
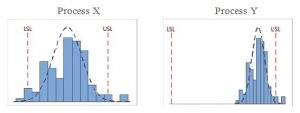
Notice that Process X has nonconforming parts in relation to both spec limits, while Process Y has nonconforming parts in relation to only the upper spec limit (USL). But Cpk can’t “see” any difference between these two processes.
To get the two-sided picture of each process, in relation to both spec limits, you can look at Cp, which would be higher for Process Y than for Process X.
For a qualitative characteristic, the Cpk value is calculated as Cpk = u(1-p)/3, where p is the estimated share of nonconforming units and u is the quintile function of the normal distribution.
Setting up SPC in SAP
There are three important steps in setting up the correct SPC parameters. 1) Maintaining correct settings in the sampling procedure, 2) Maintaining correct settings in the Master Inspection Characteristic (MIC), 3) Maintaining the desired SPC criterion in the task list.
- Maintaining Sampling Procedure: Maintaining Sampling Procedure is a must for implementing SPC. The following data must be maintained properly in the Sampling Procedure.
– Sampling Type: Only “Fixed sample” is allowed.
– Valuation Mode: If valuation is desired based on action limits, “SPC Inspection” valuation mode must be selected. However, this does not work with moving mean-average charts, EWMA chart, and moving range charts.
– Control Chart Type: The appropriate control chart type needs to be selected.
– Sample size: If both internal dispersion and process dispersion data are required, sample size has to be greater than “1.” By definition, for sample size n = 1, the internal dispersion is always zero. - Maintaining MICs: The following parameters must be maintained (as appropriate for different types of charts).
– Measured values
– Upper and Lower specification limits
– Confirmation of number of defects
– Single result
– Scope not fixed/Fixed Scope/Smaller scope/Larger scope
– If valuation based on violation of action limits is desired, then indicator for defects recording must be set, and appropriate defect codes maintained. - Maintaining criterion in task list: The SPC criterion decides whether a separate control chart will be created for each inspection lot, or for each Material/Characteristic combination across several lots, or for each Material/Characteristic/Vendor combination, etc. There are several standard criteria available in the system, but new ones can be defined in customizing.
Calculation of control limits
The calculation of control limits is maintained in customizing. Up to five control limits can be set up for each track (control variable) on a control chart:
- Upper action limit
- Upper warning limit
- Center line
- Lower warning limit
- Lower action limit.
The algorithms for the calculation of these limits are based on standard statistical methods and are already maintained in the system. However, if it is desired that users be able to manually change the control limits, the indicator “Change control limits” must be maintained in Customizing.
Setting parameters for reference axis
The parameters for the reference axis can be set in customizing. The options available are:
- Object number (inspection lot, sample, inspection point)
- Creation time (of data record)
- Time of last change (to data record)
- Inspection time.
SUMMARY
Statistical process control benefits organizations by providing a systematic method for the monitoring and evaluation of process variation. Using SPC Tools like various types of charts help in the trend analysis for the processes, analyze the vendors.